I discovered some interesting behaviour in the Excel export files from Reporting Services today. Some users of the system I’ve been working on have a requirement to periodically export the data in MS Excel format so they can do some additional analysis. They recently began testing the export function on the report in question and have noted theat they are unable to generate a pivot table because there are additional empty rows and columns before at the top and on the left of the table in the spreadsheet.
My assumption was that when you export to Excel the export rendering engine would only attempt to output the tables on the page. Obviously my assumption was invalid and the rendering engine attempts to render into Excel as closely as possible to the web version including any whitespace around the report. The more whitespace the more blank cells, rows and columns will appear in the Excel export. The quick solution to the issue is to simply move the various object on the report so the edges butt up against each other and the sides of the page. Removing the whitespace in this way means the rendering engine wont include additional empty rows or columns in the spreadsheet.
Note also that I’m note using a head or footer for the exportable version of the report. These will also cause issues if the purpose of the export is to apply a pivot table to the data for analysis.
In-line images also cause issues in the exported Excel spreadsheet. I have small icon in cells in the table with actions defined to open sub-reports. The images were embedded in rectangle objects to enable control of positioning and size. The behaviour I saw in the Excel export spreadsheet was that I had merged columns around the images and this again interfered with apply a pivot table to the data. My only solution here was to remove the images from the exportable version of the report.
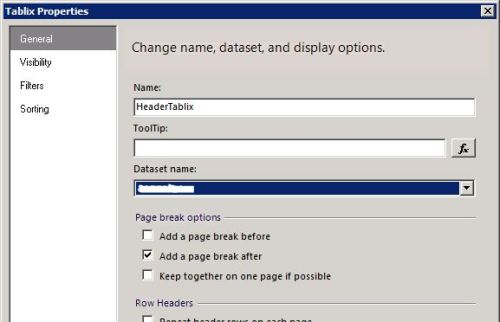
Finally, the report had two tables on the page. The first was a summary table and the second was a table containing the detail row for every item meeting the users selection parameters. When the user exports to Excel both tables appear on the one spreadsheet and the user is unable to simply create a table or pivot table on either of the data tables. Ideally the user wants each data table on its own spreadsheet. The resolution to this is again simple if you think in terms of what the rendering engine is trying to do i.e. render what it sees on the page into a similar looking spreadsheet. First we want to force the second table to appear on a new page. This is achieved by configuring the tablix for the first table to put a section break after it (see image below). Once this is configured the second table will appear on a separate page and the rendering engine will interpret the section break as needing to put the second table onto a second sheet in the Excel file.


Leave a comment